Reliability Explorer (ReX) is a R toolbox for calculating reliability and mapping individual variations to facilitate the assessment of reliability and reproducibility in neuroscience and psychology. This toolbox provides two modules. This toolbox provides two modules.
-
"Calculate Your Data" module. This module implements parametric and nonparametric methods for univariate and multivariate reliability calculation including Intraclass correlation (ICC), distance-based ICC (dbICC), Image Intraclass Correlation Coefficient (I2C2), discriminability, and identification rate (i.e. fingerprinting). The results will be presented in a two-dimensional individual variation space (see "ICC and Variation Field") to facilitate understanding of individual difference and its relation to reliability assessment. In addition, this module also provides the interactive visualization module for inspecting data and results. It will help to detect (1) which variable of interest has low reliablity, (2) which observation is a potential outliers.
-
"Compare Results (Individual Variation & Gradient Flow)" module will build a pair-wise comparison of intraclass correlation and its component variations (within- and between-individual variations). The gradient flow map provides the normalized change of the ICC as compared to the most efficient direction for improving ICC, which helps to guide optimization efforts for measurement of individual differences.
ReX R package (https://github.com/TingsterX/ReX)
ReX online shiny app (https://tingsterx.shinyapps.io/ReliabilityExplorer)
Reference:
-
ReX: an integrative tool for quantifying and optimizing measurement reliability for the study of individual differences (pdf)
-
A Guide for Quantifying and Optimizing Measurement Reliability for the Study of Individual Differences. (link)
- Basic concept
- Reliability and Validity
- Intra-class Correlation Models (ICC1, ICC2, ICC3, etc.)
- ReX toolbox
-
Reliability calculation module calculate:
- Parametric: Intraclas correlation
- Parametric: Distance-based IntraClass Correlation (dbICC)
- Nonparametric: Discriminability
- Nonparametric: Identification rate (i.e. frinterprinting)
-
Reliability Comparison module:
-
Ploting module:
Applications examples (here)
- Application 1: Behavioral tests in Human Connectome Project
- Application 2: Task vs survey comparison for measuring self-regulation (ref: Enkavi et al., 2019)
- Application 3: fMRI pipelines comparision (fMRIPrep, ABCD, CCS C-PAC)
- Application 4: fMRI pipelines with and without Global signal regression (GSR)
- Application 5: 30min vs 10min fMRI data across pipelines
- Application 6: A single long scan vs multiple shorter scan (ref: Cho et al., 2021)
https://docs.docker.com/get-docker/
docker pull tingsterx/reliability_explorer
docker run --rm -p 3838:3838 tingsterx/reliability_explorer
Open a web browser (e.g. Chrome), visit http://localhost:3838/rex
https://docs.docker.com/get-docker/
docker pull tingsterx/rex
docker run --rm tingsterx/rex
To mount your own data folder in the docker, use -v option
docker run --rm \
     -v /local/path/to/your/data:/input \
     -v /local/path/to/your/output/:/output \
     tingsterx/rex
docker run -it --rm --entrypoint R \
     -v /local/path/to/your/data:/input \
     -v /local/path/to/your/output/:/output \
     tingsterx/rex
See more help messages and demo code here
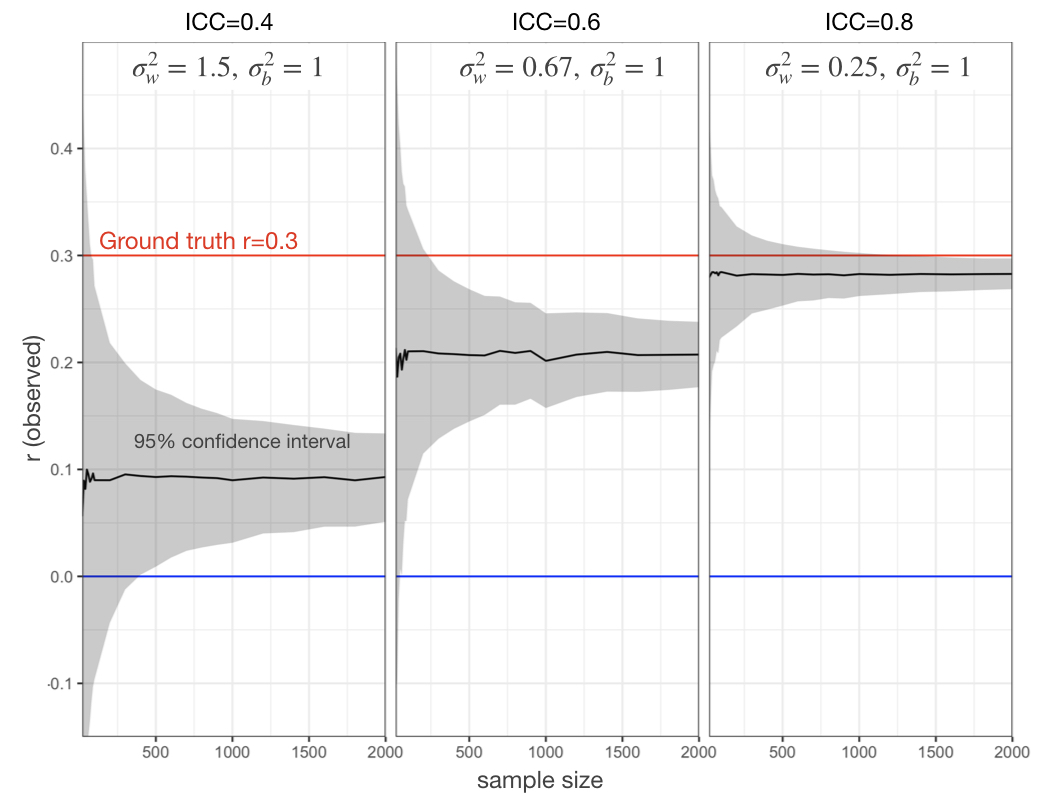
Relationship between reliability and validity (details here)
Both reliability and sample size matter for examining the association between two variables of interest
simulation: here


