900_020_statistics
Previous Chapter Previous Page Next Page Table of content
The purpose of a graphics is to display data in a visual way. People who visualize the chart will have a better comprehension of the data. The theory that is behind this method is called "Descriptive statistics". This is a small part of a wider theory. Another part of statistics computes values; the most kown of them is the mean; but values like the standard deviation, the median, the quartiles are other values that helps to "summarize" lot of data. Through the "stats.js" add-ins module, some of well known statistical values are computed.
This chapter lists the statistical values computed by the stats.js module.
-
count_all, count_missing, count_not_missing
Count_missing : count the number of missing values in the data;
count_not_missing : count the number of not missing values in the data;
count_all=count_missing+count_not_missing; -
sum
sum : sum of the not missing values; -
mean
mean = sum / count_not_missing; -
sum_square_diff_mean
sum_square_diff_mean=sum of the (values-mean)^2 -
sum_pow3_diff_mean
sum_pow3_diff_mean=sum of the (values-mean)^2 -
sum_pow4_diff_mean
sum_pow3_diff_mean=sum of the (values-mean)^4 -
variance
variance=sum_square_diff_mean/count_not_missing -
standard_deviation
standard_deviation=square root (variance) -
standard_deviation_estimation
standard_deviation_estimation=square root(sum_square_diff_mean/(count_not_missing-1)) -
standard_error_mean
standard_error_mean=square root(sum_square_diff_mean) / count_not_missing; -
Skewness
skewness=count_not_missingsum_pow3_diff_mean/((standard_deviation_estimation^3)(count_not_missing-1)*(count_not_missing-2)) -
Kurtosis
kurtosis= count_not_missing*(count_not_missing+1)sum_pow4_diff_mean)/((standard_deviation_estimation^4)(count_not_missing-1)(count_not_missing-2)(count_not_missing-3))-3*(count_not_missing-1)^2/((count_not_missing-2)*(count_not_missing-3)) -
coefficient_variation
coefficient_variation=standard_deviation_estimation/mean; -
student_t_test student_t_test=mean/(standard_deviation_estimation/square root(count_not_missing))
-
minimum
minimum of the values -
maximum
maximum of the values -
Q0, Q1, Q5, Q10, Q25, Q50, Q75, Q90, Q95, Q99, Q100
Qx = the value obtained with following algorith :
-> The data are ordered;
-> x% of the data are lower than Qx; (100-x)% of the values are greater than Qx.
The Qx values are computed like they are computed in the SAS software which is a software well know in the statistical world.
Special values :
Q0 : minimum value;
Q100 : maximum value;
-
Median
median=Q50 -
Interquantile_range
interquantile_range=Q75-Q50 -
linear_regression_b0 and linear_regression_b1
The stats module compute the line that best fits a distribution of points - This is known has "linear regression". The line that best fits a distribution of point will be represented by the function :
linear_regression_b0 + linear_regression_b1 * X
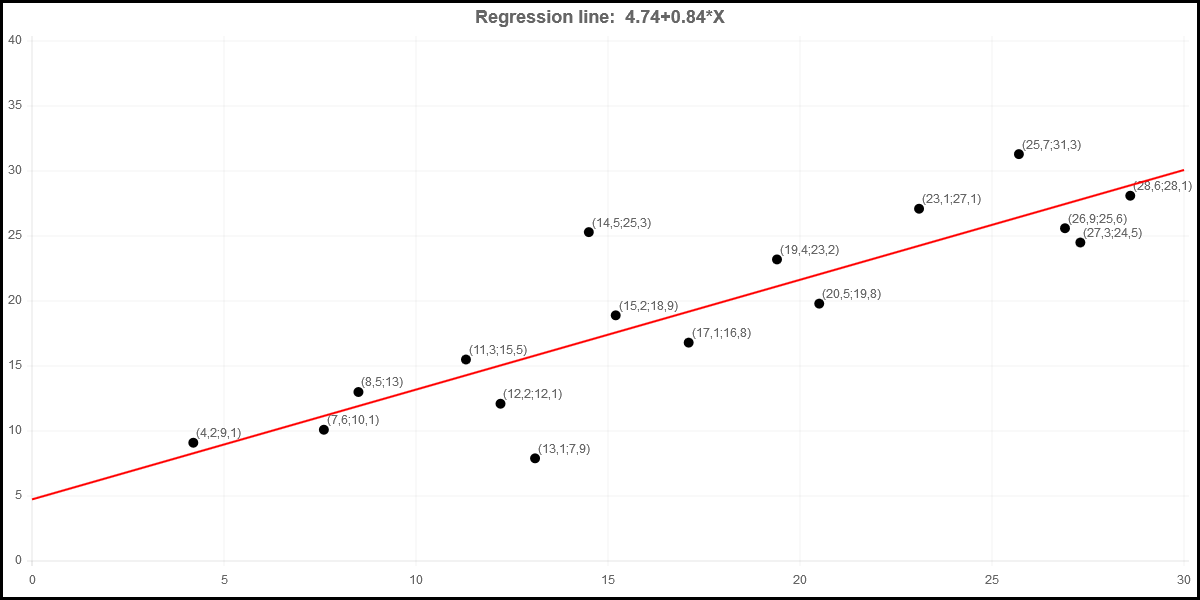
The program associated to this chart is available at https://github.com/FVANCOP/ChartNew.js/Samples/plot_graph.html
To compute those two values, other intermediate values have to be computed; The values listed here after are used to compute those two values.
linear regression is only computed for the line extended structure (see : 070_010_Line)
-
linear_regression_count_xPos
Number of couple of data (x,y) taken in account for the computation of the other linear regression statistics -
linear_regression_sum_xPos
Sum of the xPos values used to compute the linear regression -
linear_regression_sum_data
Sum of the data values used to compute the linear regression -
linear_regression_mean_xPos
linear_regression_mean_xPos=linear_regression_sum_xPos/linear_regression_count_xPos -
linear_regression_mean_data
linear_regression_mean_data=linear_regression_sum_data/linear_regression_count_xPos -
linear_regression_covariance
Covariance of the couple of data (x,y) -
linear_regression_variance
Variance of the couple of data (x,y)
If you want to compute the statistal value listed in previous chapter, include the "Add-ins\stats.js" module and call the "stats" function with the parameters data and config.
 <SCRIPT src='..\Add-ins\stats.js'></script>
 (...)
 <SCRIPT>
 var mydata1= {
 (...)
 };
 var statOptions = {
 (...)
 };
 stats(mydata1,statOptions);
 </SCRIPT>
When the "stats(<data>,<options>) has been called, the following values are available :
<data>.stats.<statistic> where <statistic> is one of the value listed in previous chapter.
For instance, <data>.stats.mean, <data>.stats.variance, ... are available.
Example :
 <SCRIPT src='..\Add-ins\stats.js'></script>
 <SCRIPT>
 var mydata1= {
labels : ["January","February","March","April","May","June"],
datasets : [
	{
		fillColor : "rgba(220,220,220,0.5)",
		strokeColor : "rgba(220,220,220,1)",
		pointColor : "rgba(220,220,220,1)",
		pointStrokeColor : "#fff",
		data : [7,10,15,15,13,8],
                    title : "Europe"
	},
	{
		fillColor : "rgba(151,187,205,0.5)",
		strokeColor : "rgba(151,187,205,1)",
		pointColor : "rgba(151,187,205,1)",
		pointStrokeColor : "#fff",
		data : [10,13,12,15,8,15],
                    title : "North-America"
	}
 };
 var statOptions = {
       canvasBorders : true
 };
 stats(mydata1,statOptions);
 </SCRIPT>
When executed the following values are available :
 mydata1.stats.count_all;
 mydata1.stats.count_not_missing:
 mydata1.stats.count_missing;
 mydata1.stats.mean;
 mydata1.stats.variance;
 (...)
This gives statistical value for the whole data. If the data are in the form of data for Lines/Bars/Stacked Bars charts other values are also available :
<data>.datasets[i].stats. -> <statistic> for the data in <data>.datasets[i].data[*].
<data>.stats.data_[j] -> <statistic> for the data in <data>.datasets[*].data[j].
Example : From previous example, following statistics are also available :
mydata1.datasets[i].stats.mean (for i=0->1)
mydata1.datasets[i].stats.count_all (for i=0->1)
mydata1.datasets[i].stats.count_missing (for i=0->1)
(...)
mydata1.stats.data_mean[j] (for j=0->5)
mydata1.stats.data_count_all[j] (for j=0->5)
mydata1.stats.data_count_missing[j] (for j=0->5)
(...)
The function disp_stats(data) can be used to print all computed statistics.
 <SCRIPT src='..\Add-ins\stats.js'></script>
 <SCRIPT>
 var mydata1= {
labels : ["January","February","March","April","May","June"],
datasets : [
	{
		fillColor : "rgba(220,220,220,0.5)",
		strokeColor : "rgba(220,220,220,1)",
		pointColor : "rgba(220,220,220,1)",
		pointStrokeColor : "#fff",
		data : [7,10,15,15,13,8],
                    title : "Europe"
	},
	{
		fillColor : "rgba(151,187,205,0.5)",
		strokeColor : "rgba(151,187,205,1)",
		pointColor : "rgba(151,187,205,1)",
		pointStrokeColor : "#fff",
		data : [10,13,12,15,8,15],
                    title : "North-America"
	}
 };
 var statOptions = {
       canvasBorders : true
 };
 stats(mydata1,statOptions);
 </SCRIPT>
 <html>
 <body>
 <script>disp_stats(mydata1);</script>
 </body>
 </html>
Those computed statistics can be used through JS programs, but can also be used in your data and your options : all statistical values surrounded by "#" in your data or in your options will be replaced bye the corresponding value.
Example : if you want to put the mean value in your footnote, process like this for the footNote option :
footNote : "computed mean : #MEAN#",
=> the stat function will replace #MEAN# by the real computed mean value.
You can also specify "templates" in your data/options if you want to compute another value based on one or more statistic.
If you want to substitute a "dataset" statistic, put the "DS_" prefix in front of the stat and specify the dataset between parenthesis.
Example: #DS_MEAN(2)# will be subsituted by the value of data.datasets[2].stats.mean
If you want to substitute a "column" statistic, put the "DATA_" prefix in front of the stat and specify the column between parenthesis.
Example: #DATA_MEAN(2)# will be subsituted by the value of data.stats.data_mean[2]
In the data part, when the you refers to a dataset or column statistic, you don't have to specify the dataset or the column if it refers to the dataset/column where the replacement has to be done.
These are very good samples : (available in the samples directory).
<!doctype html>
<SCRIPT src='..\ChartNew.js'></script>
<SCRIPT src='..\Add-ins\stats.js'></script>
<SCRIPT>
defCanvasWidth=1200;
defCanvasHeight=600;
var mydata1 = {
labels : ["January","February","March","April","May","June"],
datasets : [
{
fillColor : "rgba(220,220,220,0.5)",
strokeColor : "rgba(220,220,220,1)",
pointColor : "rgba(220,220,220,1)",
pointStrokeColor : "#fff",
data : [7,10,15,15,13,8],
title : "Europe"
},
{
fillColor : "rgba(151,187,205,0.5)",
strokeColor : "rgba(151,187,205,1)",
pointColor : "rgba(151,187,205,1)",
pointStrokeColor : "#fff",
data : [10,13,12,15,8,15],
title : "North-America"
},
{
fillColor : "rgba(187,151,205,0.5)",
strokeColor : "rgba(187,151,205,1)",
pointColor : "rgba(187,151,205,1)",
pointStrokeColor : "#fff",
data : [11,14,13,12,15,18],
title : "South-America"
},
{
fillColor : "rgba(151,187,151,0.5)",
strokeColor : "rgba(151,187,151,1)",
pointColor : "rgba(151,187,151,1)",
pointStrokeColor : "#fff",
data : [12,16,10,5,7,11],
title : "Asia"
},
{
type : "Line",
fillColor : "rgba(0,220,0,0.5)",
strokeColor : "rgba(0,220,0,1)",
pointColor : "rgba(0,220,0,1)",
pointStrokeColor : "#fff",
data : ["#data_mean#","#data_mean#","#data_mean#","#data_mean#","#data_mean#","#data_mean#"],
title : "Mean Value of the month"
},
{
type : "Line",
fillColor : "rgba(0,0,220,0.5)",
strokeColor : "rgba(0,0,220,1)",
pointColor : "rgba(0,0,220,1)",
pointStrokeColor : "#fff",
data : ["#mean#","#mean#","#mean#","#mean#","#mean#","#mean#"],
title : "Mean Value (<%=roundToNumber(#mean#,-2)%>)"
}
]
}
var statOptions = {
canvasBorders : true,
canvasBordersWidth : 3,
canvasBordersColor : "black",
scaleXGridLinesStep : 9999,
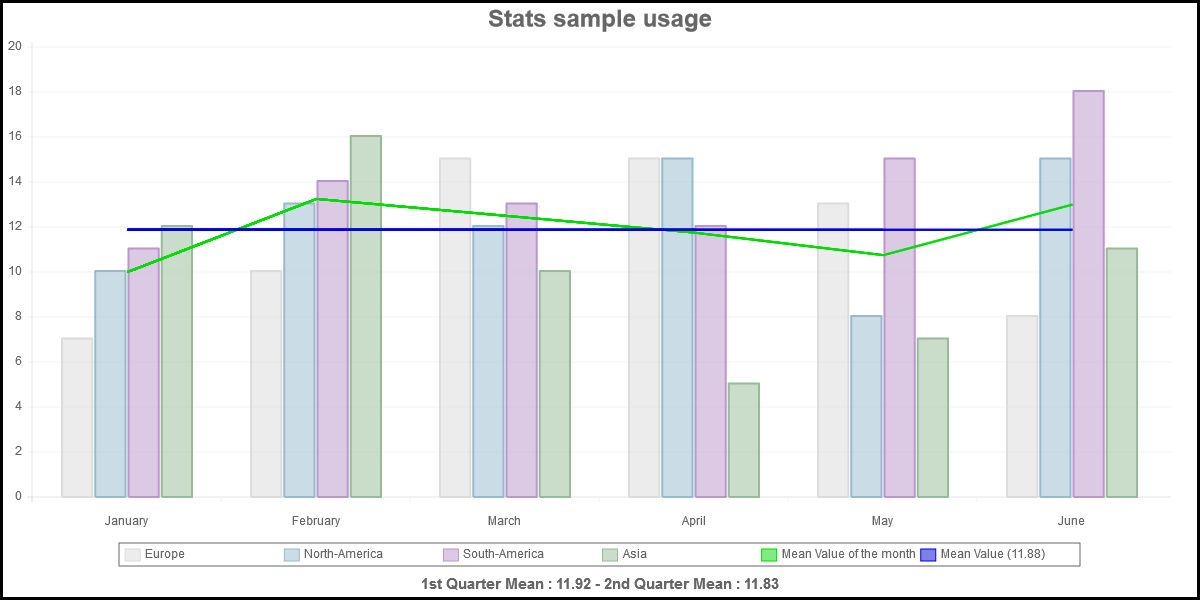
graphTitle : "Stats sample usage",
graphTitleFontFamily : "'Arial'",
graphTitleFontSize : 24,
graphTitleFontStyle : "bold",
graphTitleFontColor : "#666",
yAxisMinimumInterval : 1,
annotateDisplay : true,
annotateLabel: "<%= v1 + ' : ' + v3%>",
legend : true,
barValueSpacing : 30,
footNoteFontSize : 15,
animationLeftToRight : true,
animationEasing : "linear",
animationSteps : 200,
footNote : "1st Quarter Mean : <%=roundToNumber((#DATA_MEAN(0)#+#DATA_MEAN(1)#+#DATA_MEAN(2)#)/3,-2)%> - 2nd Quarter Mean : <%=roundToNumber((#DATA_MEAN(3)#+#DATA_MEAN(4)#+#DATA_MEAN(5)#)/3,-2) %>"
}
function roundToNumber(num, place) {
var newval=1*num;
if(typeof(newval)=="number"){
if(place<=0){
var roundVal=-place;
newval= +(Math.round(newval + "e+" + roundVal) + "e-" + roundVal);
}
else {
var roundVal=place;
var divval= "1e+"+roundVal;
newval= +(Math.round(newval/divval))*divval;
}
}
return(newval);
} ;
</SCRIPT>
<html>
<meta http-equiv="Content-Type" content="text/html;charset=utf-8" />
<head>
<title>Demo ChartNew.js</title>
</head>
<body>
<script>
stats(mydata1,statOptions);
document.write("<canvas id=\"canvas_bar\" height=\""+defCanvasHeight+"\" width=\""+defCanvasWidth+"\"></canvas>");
window.onload = function() {
var myBar = new Chart(document.getElementById("canvas_bar").getContext("2d")).Bar(mydata1,statOptions);
}
</script>
</body>
</html>

<!doctype html>

<SCRIPT src='..\ChartNew.js'></script>
<SCRIPT src='..\Add-ins\stats.js'></script>

<SCRIPT>

defCanvasWidth=1200;
defCanvasHeight=600;

var mydata1 = [
    {
	value : 30,
	color: "#D97041",
            title : "data1"
},
{
	value : 90,
	color: "#C7604C",
            title : "data2"
},
{
	value : 24,
	color: "#21323D",
            title : "data3"
},
{
	value : 58,
	color: "#9D9B7F",
            title : "data4"
},
{
	value : 82,
	color: "#7D4F6D",
            title : "data5"
},
{
	value : 8,
	color: "#584A5E",
            title : "data6"
}
];


var varcrosstxt = {
  canvasBordersWidth : 3,
  canvasBordersColor : "black",
  crossText : ["Total:\n#sum#"],
  crossTextIter: ["all"],
  crossTextOverlay :   [true],
  crossTextFontSize : [50],
  crossTextFontColor : ["black"],
  crossTextRelativePosX : [2],
  crossTextRelativePosY : [2],
  crossTextAlign : ["center"],
  crossTextBaseline : ["middle"],
  inGraphDataShow : true,
  legend : true,
  canvasBorders : true,
  graphTitle : "Sample - Sum of the data in the middle",
  graphTitleFontFamily : "'Arial'",
  graphTitleFontSize : 24,
  graphTitleFontStyle : "bold",
  graphTitleFontColor : "#666",
  footNoteFontSize : 15,
  footNote : "Mean Value : <%=roundToNumber(#MEAN#,-2)%> - Standard Deviation : <%=roundToNumber(#standard_deviation#,-2)%>"
}

function roundToNumber(num, place) {
  var newval=1*num;

  if(typeof(newval)=="number"){
    if(place<=0){
      var roundVal=-place;
      newval= +(Math.round(newval + "e+" + roundVal) + "e-" + roundVal);
    }
    else {
      var roundVal=place;
      var divval= "1e+"+roundVal;
      newval= +(Math.round(newval/divval))*divval;
    }
  }
  return(newval);
} ;

</SCRIPT>

<html>
<meta http-equiv="Content-Type" content="text/html;charset=utf-8" />
<head>
	<title>Demo ChartNew.js</title>

</head>
<body>

<script>

stats(mydata1,varcrosstxt);

document.write("<canvas id=\"canvas_pie\" height=\""+defCanvasHeight+"\" width=\""+defCanvasWidth+"\"></canvas>");

window.onload = function() {
  var myBar = new Chart(document.getElementById("canvas_pie").getContext("2d")).Doughnut(mydata1,varcrosstxt);
}
</script>
</body>
</html>